Company Snapshot
Analysis and scenarios: ChatGPT.
Update after Q3 2026 results
Revenue grew 96% year over year, U.S. commercial revenue 148%, NDR reached 165%, and GAAP operating margin was 47%. FY2026 guidance was raised. This is new operating evidence for demand durability, execution and economics, while valuation remains a separate question.
Palantir Technologies · NASDAQ: PLTR
Palantir connects enterprise data, decisions and actions in a common operating layer. The thesis rests on that layer becoming more important with AI. Results are exceptionally strong, but the share price already requires several more years of exceptional execution.
| Area | Current view |
|---|---|
| Sector | Enterprise software, AI, defense and public administration |
| Thesis status | Strengthening business thesis; high valuation constrains expected return |
| Confidence | High in the competitive position; substantially lower in price attractiveness |
| Horizon | 3+ years |
| Latest review | October 19, 2026; Q2 2026 financial basis, Customers Bank, Knox and UK risks; methodology 1.2 and a new intraday quote |
Investment thesis: Ontology, operating experience and AIP can make Palantir key infrastructure for deploying AI into real organizational operations. The moat comes from connecting enterprise context, permissions and safe actions. High company quality does not justify any share price.
What matters most
- Ontology and operating integration: can Palantir sustain its advantage where an incorrect action has real cost?
- Customer expansion: Q2 US commercial revenue grew 149% and net dollar retention reached 157%.
- Deployment scaling: growth must continue without proportionate increases in implementation cost.
- Per-share return: cash-flow growth must exceed dilution and any valuation compression.
Key financial picture: Q2 2026 revenue USD 1.935 billion, +93% year over year, GAAP operating margin 47%, adjusted FCF USD 1.220 billion. FY2026 revenue guidance is USD 8.150–8.158 billion. Results and guidance
November 16, 2026 — Two live deployments at Zeta customers and a five-year UK police award add evidence of Foundry adoption but do not change financial assumptions or business strength. A lower entry price modestly improves attractiveness, while the margin of safety remains small. Price attractiveness 2.4/10 at USD 160.39, November 16, 2026 regular close. Three-year returns are 29.9% (base) and -55.4% (adverse), with unchanged scenario assumptions.
Investment Thesis
Update after Q3 2026 results
Revenue grew 96% year over year, U.S. commercial revenue 148%, NDR reached 165%, and GAAP operating margin was 47%. FY2026 guidance was raised. This is new operating evidence for demand durability, execution and economics, while valuation remains a separate question.
Palantir can monetize the translation of general model intelligence into specific economic value. Organizations need AI to understand customers, machines, inventory, obligations and processes, use the right data and perform only permitted actions. Palantir has an integrated architecture and demanding deployment experience for this task.
Three supports: Ontology grounds AI in enterprise reality; AIP expands usable workflows; deeper integration supports customer expansion. Q2 US commercial customers grew 35%, while segment revenue grew 149%. This strongly signals rising spending and platform importance, although contract size and timing also affect results.
ChatGPT investment conclusion: Company quality and share attractiveness at a specific price are separate questions. A strong competitive position does not eliminate the need to evaluate prospective returns and valuation-compression risk.
The Business
| Platform component | Thesis role |
|---|---|
| Gotham and Maven | Analytics and operational decisions in government and defense; critical-deployment experience. |
| Foundry | Data integration and organizational operating models; foundation for reusable data and workflows. |
| Ontology | Common model of objects, relationships, logic, actions and permissions. Connects data to how an organization actually works. |
| AIP | LLM connections, agent development and evaluation, and integration into operational workflows. |
| Apollo | Software deployment and management across operating environments. |
Foundry, AIP and Apollo form a connected stack. Building further applications and agents on the same enterprise context matters. AIP architecture
Q2 commercial revenue was roughly USD 945 million and government revenue USD 990 million. The US represented over 81% of total revenue. Growth is heavily US-driven; international expansion is another opportunity, but currently grows much more slowly. Source: attached Q2 2026 earnings transcript.
- The UK BCH award covers secure data integration and analysis for the Bedfordshire, Cambridgeshire and Hertfordshire police forces from October 8, 2026 to October 8, 2031. The reported GBP 10.093m excluding VAT works out to about GBP 2m annually and does not change group scenarios.
Competitive Advantages
Ontology as a moat and digital-twin harness
The harness analogy describes this layer well. Here, a harness supplies a model with context, tools, permissions and action controls. Ontology is a key part: it represents enterprise reality, relationships and available operations. Palantir describes it as an organizational digital twin with semantic and action layers. Ontology overview
Long before LLMs were “cool,” Palantir developed architecture now well suited to acting as a harness for an enterprise digital twin. A roughly fifteen-year head start is shorthand for foundational development and operating know-how, not a claim that today's Ontology, AIP and agent tools already existed in their present form.
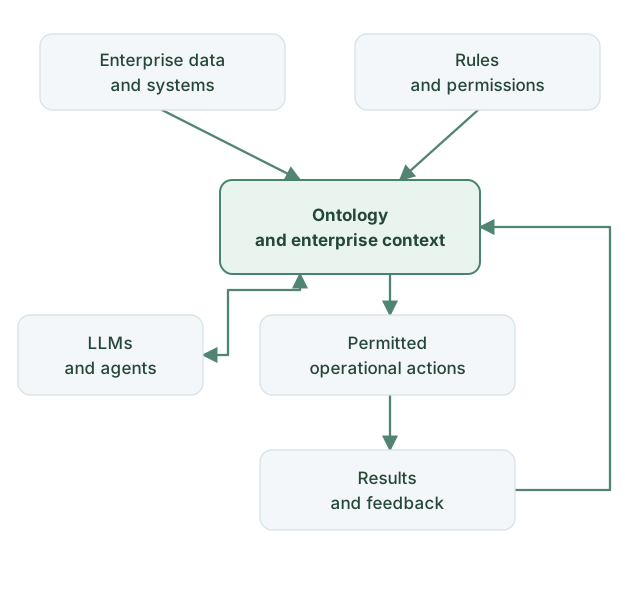
The analysis identifies the real moat as architecture, operating integration and implementation experience combined. A customer's ontology accumulates relationships, rules and workflows. Replacement requires transferring and revalidating operations, not merely rewriting code. Forward-deployed engineers connect software with customers' human and organizational habits.
The moat has limits. Enterprise ontology is not Palantir's exclusive concept; competitors can implement it. Microsoft offers its own ontology in Fabric IQ, currently in preview. Better operating results and investment returns are decisive, not merely using the word ontology. Microsoft Fabric IQ
New operating examples from October 21–22, 2026. L3Harris describes hundreds of applications built on Ontology, while McCarthy and Tampa General report broader workflow use. These are primarily company and customer claims without disclosed economics for Palantir, but they provide more concrete evidence of integration depth. Sovereign AI
Growth Drivers
Update after Q3 2026 results
Revenue grew 96% year over year, U.S. commercial revenue 148%, NDR reached 165%, and GAAP operating margin was 47%. FY2026 guidance was raised. This is new operating evidence for demand durability, execution and economics, while valuation remains a separate question.
- US commercial: new customers and expansion into more business areas. Q2 revenue USD 764 million, +149% year over year and +28% sequentially.
- Existing-customer expansion: 157% NDR and larger contracts support the idea that an initial deployment opens more workflows.
- US government: Q2 revenue USD 809 million, +90% year over year; further growth depends on winning and executing programs.
- Sovereign AI: management emphasizes customer control over models, proprietary evaluations and learning within its security environment. A broader stack could increase spending.
- Zeta and ecosystem expansion: Zeta’s official October 7, 2026 release confirms strategic collaboration and integration through Palantir Foundry. It could extend the operational layer into customer intelligence; that is a ChatGPT analytical assumption. The release does not quantify Palantir revenue or FCF contributions, so the scenarios add no separate partnership revenue.
- Deployment productivity: development tools and AI can accelerate implementation teams. This operating-leverage hypothesis must be confirmed by company economics.
Beyond the horizon: cheaper application creation could increase the value of the shared operating layer beneath applications. Palantir could benefit from more apps and agents, provided customers buy that layer from Palantir and competition does not compress its price. This is a strategic scenario, not certainty.
- Customers Bank: The October 15 joint announcement confirms Foundry and AIP deployment for opening and servicing deposit accounts, with Palantir teams already working alongside the bank’s engineers. Faster onboarding and scaling are partnership goals, not reported PLTR results. Contract value and revenue contribution are undisclosed, so the financial model is unchanged.
- Knox Systems / federal distribution: The October 19 joint release announces a partnership to deploy software in FedRAMP and IL5 federal environments. It may broaden distribution capacity, but Knox’s more than 100 applications are not 100 new Palantir customers. Without contract value and volume, the model is unchanged.
Deployment capacity. Elevating Aplos Data to Vanguard Elite partner status may expand implementation capacity. The announcement discloses no contract value, revenue, or FCF impact, so growth assumptions remain unchanged. Aplos Data
The Q3 call described several pilot conversions into eight-figure annual contracts. This supports land-and-expand, but is offset by only 11% growth in U.S. commercial TCV, 6% in total TCV and flat RPO versus Q2; several large contracts had shorter-than-usual terms.
- On its November 9 earnings call, Zeta reported eight customer approvals, two live deployments and additional cases in contracting, with one large deployment expected by month-end. Zeta says its Data Cloud is fully integrated over Foundry and Ontology. Its estimate of more than USD 100m in future annual revenue concerns Zeta, not Palantir.
Economics & Financial Profile
Update after Q3 2026 results
Revenue grew 96% year over year, U.S. commercial revenue 148%, NDR reached 165%, and GAAP operating margin was 47%. FY2026 guidance was raised. This is new operating evidence for demand durability, execution and economics, while valuation remains a separate question.
| Q2 2026 metric | Value |
|---|---|
| Revenue | USD 1.935 billion |
| GAAP operating income and margin | USD 912 million / 47% |
| Adjusted operating income and margin | USD 1.194 billion / 62% |
| Operating cash flow | USD 1.216 billion |
| FCF as CFO less CapEx | USD 1.202 billion |
| Adjusted FCF and margin | USD 1.220 billion / 63% |
| Stock-based compensation | USD 265 million / 13.7% of revenue |
| Cash, equivalents and short-term US Treasuries | USD 9.2 billion |
Results show strong operating leverage: rapid growth alongside substantial GAAP operating profit. Cash flow needs care. Adjusted FCF adds back selected employer taxes related to stock awards; CFO less CapEx is roughly USD 18.7 million lower. SBC is not economically free merely because it is not a direct cash expense.
In H1, contract liabilities helped cash flow by USD 257 million, while receivables growth consumed USD 434 million. Cash generation therefore cannot be explained solely by upfront subscription collections. Track collections, cash taxes and FCF per diluted share for sustainable returns.
The 55% GAAP net margin is not an automatic long-term assumption: Q2 included investment income and a very low reported effective tax rate around 1.4%. The CFO also cited USD 0.03 GAAP EPS from unrealized SpaceX gains. GAAP operating margin and normalized cash flow better assess operations.
Financial figures and calculations use the attached release and transcript; official results and reconciliation.
For the first nine months of 2026, CFO was $3.320 billion and CFO less capex was $3.290 billion. The Q3 10-Q reports about $2.0 billion of unrecognized stock-compensation expense and at least $5.6 billion of cloud-service commitments through 2036. These are not current debt, but they constrain overly optimistic extrapolation of margins and per-share value.
Key KPIs
Update after Q3 2026 results
Revenue grew 96% year over year, U.S. commercial revenue 148%, NDR reached 165%, and GAAP operating margin was 47%. FY2026 guidance was raised. This is new operating evidence for demand durability, execution and economics, while valuation remains a separate question.
| KPI | Q2 2026 | Thesis test |
|---|---|---|
| Total revenue growth | +93% year over year | Growth on a larger base alongside margins. |
| US commercial | +149% year over year | Durable demand and expansion beyond the first use case. |
| US commercial customers | 653; +35% year over year | Breadth versus reliance on a few large contracts. |
| Net dollar retention | 157% | Do customers keep spending more? |
| US commercial TCV | USD 2.132 billion; +153% | Contract inflow, duration and conversion into revenue. |
| US commercial RDV | USD 6.238 billion; +124% | Future revenue potential and option exercise. |
| Total RPO | USD 4.9 billion; +103% | Firmer contractual revenue foundation. |
| GAAP operating margin | 47% | Growth economics after stock compensation. |
| FCF per diluted share | USD 0.468; +125.5% YoY | CFO less CapEx / weighted diluted shares; own calculation from Q2 2026 and Q2 2025. Not a normalized annual run rate. |
TCV, RDV and RPO differ. TCV and RDV assume options are exercised and no early termination; some contracts can terminate without breach. RPO captures firmer unrecognized obligations but excludes some short and cancelable contracts. Do not add these metrics or treat them as realized revenue.
Management & Capital Allocation
Alex Karp and Shyam Sankar provide strategic continuity. Their strength is investing long term in architecture and deployment practices whose importance became clear with AI. Growth, GAAP profit and cash flow now accompany the strategy.
Between the lines: the Q2 call shifts from LLM deployment toward ownership of operational learning: customer evaluations, feedback and adapted models. This could expand Palantir's role. Criticism of frontier labs is also commercial positioning; claims about surrendering customer secrets are not evidence that competitors breached contracts.
Over the next 12–24 months, management must scale deployments faster, turn large contracts into revenue and increase normalized cash flow per share. Strong cash reserves support people and product investment; assess stock awards alongside dilution.
Claims of extreme future growth express ambition. Official post-Q2 FY2026 adjusted FCF guidance is USD 4.5–4.7 billion. July's analytical note cites Karp's televised idea of USD 15–18 billion annual FCF in roughly two years; Neither is used as official guidance or a base forecast. In the August 3, 2026 Q2 call, Karp also set an ambition for business growth over the next 18 months at least matching the then-current US commercial rate. The available transcript supports the statement; it specifies neither a binding quarterly plan nor automatic extrapolation of +149% to the entire company.
Management cited examples of pilots expanding from roughly $3 million to $29 million of annual value, from $1.6 million to $21 million, and from $1 million through $3 million to $15 million. These are individual management claims, not an audited cohort disclosure.
Risks / Bear Case
- Valuation: the main new-capital risk. Excellent growth can still deliver weak returns if multiples normalize downward.
- Microsoft and other platforms: cheaper solutions within existing contracts may suffice for some customers. Palantir must justify its premium through measurable outcomes.
- Deployment capacity: deep integration is both advantage and constraint. Excessive expensive implementation work worsens scaling economics.
- Concentration: over 81% US revenue, major government programs and large commercial contracts increase sensitivity to budgets, decision cycles and timing.
- Governance and trust: security incidents, problematic AI use or lost trust can weaken the value the platform protects.
- Dilution and earnings quality: absolute FCF growth is not per-share value growth; investment gains and low taxes are not automatically permanent.
Strongest bear case: Palantir is an exceptional implementer whose lead gradually narrows through hyperscale platforms and cheaper AI tools. Revenue keeps growing, but customers no longer pay the same premium and the stock multiple falls sharply. This requires no business collapse.
- UK procurement — MOPAC: The October 14 joint statement confirms the end of litigation and withdrawal of mutual allegations. MOPAC attributes the May decision not to award the UOA contract to process, cost and value-for-money considerations rather than Palantir’s values or ethics; the company may compete in a new tender. This removes part of the legal uncertainty but is not a contract win or reported revenue.
- NHS — actual use and benefit: An October report raises questions about non-use by some trusts and incremental benefit. A primary Gloucestershire response dated February 6, 2026 documented no product use at that point and no rollout date, while noting some trust data in the FDP and discussions with NHS England. Against that, the NHS England 2025/26 annual report, published September 3, reported about 113 trusts and 41 ICBs using the platform by March 2026 and operating improvements, while warning that before/after comparisons do not establish causation. Analytical conclusion: adoption, measurable return and trust must be verified deployment by deployment; neither aggregate marketing nor one failure proves a universal moat or its disappearance. The financial impact for PLTR is not quantified.
Technology sovereignty. Palantir says neither NATO nor other buyers face a Maven “kill switch” controlled by the company or the U.S. government and that the software can run without Palantir. This is an important management assurance rather than an independent technical audit. France and Germany have not adopted Maven for their armed forces, so sovereignty remains both a sales argument and a barrier to adoption. Reuters, October 22, 2026
The Q3 10-Q says the largest customer represented 27% of receivables, while the three largest customers accounted for 16% of nine-month revenue. Shorter and terminable contracts reduce visibility even while the company continues to grow rapidly.
Valuation
ChatGPT produces the calculations and valuation scenarios. Share-price inputs are dated to the analysis; they are not continuously updated market data.
Different outcomes. Different values.
160.39 USD · November 16, 2026 · regular close
Price attractiveness 2.4/10 at USD 160.39, November 16, 2026 regular close. Three-year returns are 29.9% (base) and -55.4% (adverse), with unchanged scenario assumptions.
| Item | Base | Adverse |
|---|---|---|
| Business assumptions | USD 25bn revenue in 2029, from FY2026 guidance of USD 8.530–8.534bn, or about 43% annual growth; normalized FCF margin 50%, FCF USD 12.5bn | Competition and implementation constraints curb annual growth to 26%; revenue USD 17bn, margin 40%, FCF USD 6.8bn |
| Diluted shares / FCF per share | 2.70bn / USD 4.63, including stock compensation | 2.85bn / USD 2.39, more stock compensation and less buyback offset |
| Funding | Operating cash flow, no major acquisition or new net debt | No liquidity crisis or forced debt; slower per-share progress and multiple compression |
| Exit valuation | 45× P/FCF, requiring continued growth and moat | 30× P/FCF, reflecting slower growth and weaker pricing power |
| Three-year price | USD 208.33 | USD 71.58 |
| Dividends | USD 0 | USD 0 |
| Total return | +29.9% | −55.4% |
The price is FCF times P/FCF, divided by diluted shares; return is (price plus dividends) / 160.39 − 1. As this uses an equity multiple, no separate cash adjustment is made and share dilution is counted once. Returns are before tax, fees and CZK conversion. The November 16 close was 5.2% below November 9. Medium confidence: results and the close are documented, but margins, growth, dilution and multiples are assumptions. At USD 150, the same base case would yield about +38.9%; that would warrant reassessment, not an automatic purchase signal. Stronger FCF per share or a lower entry without weaker fundamentals would improve the assessment. Worse conversion, higher dilution or a weaker moat would require a revision.
What Would Change the Assessment?
| Signal | Thesis significance | Review response |
|---|---|---|
| Demonstrably worse deployment outcomes or key customers lost to competitors | Weaker moat | Reassess long-term competitive-position assumption. |
| NDR below 130% for two consecutive quarters with weaker contract conversion | Weaker customer expansion | Check mix and seasonality; lower growth assumptions if structural. |
| Two quarters of revenue growth without corresponding normalized FCF-per-share growth | Worse shareholder economics | Analyze collections, taxes, costs and dilution. |
| Major security incident or loss of a key government program | Trust or substantial business threatened | Immediately review impact and thesis. |
| Lower valuation with intact quality, or higher demonstrable FCF | Potential appeal of a new purchase | Recalculate expected returns and price cushion. |
Numerical thresholds are working analytical signals, not preapproved automatic orders. Slowing from today's extreme growth need not break the thesis; causes and long-term cash-flow effects matter.
Killer questions checklist
- If Microsoft supplies most features within an existing contract, which outcomes still command Palantir's premium?
- Is the moat deeply integrated operations or mainly today's implementation-team lead?
- How much FCF remains after normalizing taxes, collections and stock-award economics?
- What must the company achieve to justify paying today's multiple in three years too?
Current View
Ontology, operating experience and AIP form a strong competitive position. The Q3 10-Q and call confirm rapid pilot expansion and strong operating leverage, but shorter contracts, weaker TCV growth, flat RPO, and cloud and SBC commitments prevent a further increase. Strength is 8.9/10; attractiveness is 2.4/10 at $160.39.
Two live deployments at Zeta customers and a five-year UK police award add evidence of Foundry adoption but do not change financial assumptions or business strength. A lower entry price modestly improves attractiveness, while the margin of safety remains small. Assessment and scenarios: ChatGPT.
Five equally weighted dimensions (competitive advantage, demand durability, execution, economics, resilience): 9.0 / 9.2 / 8.3 / 8.1 / 10.0.
Thesis History / Updates
November 2, 2026: Q3 results raised company strength from 8.8 to 8.9 and price attractiveness from 2.0 to 2.2 at the $178.34 close. Base / adverse three-year return is +16.8% / −59.9%.
| Date | Analysis development | Impact |
|---|---|---|
| July 18, 2026 | Research note builds the thesis on operating context, Ontology and ownership of enterprise learning; highlights Microsoft as a competitor. | Stronger architecture thesis without assuming a monopoly. |
| August 3, 2026 | Q2 results: revenue +93%, US commercial +149%, NDR 157% and raised guidance. | Strong confirmation of growth and operating leverage. |
| October 10, 2026 | First methodology 1.0 review; added five areas, two three-year scenarios, per-share FCF and the Zeta partnership. October 9 close USD 209.05. | Company strength 8.8/10; price attractiveness 2.0/10. |
| October 12, 2026 | Added Regna AI without raising financial assumptions. Close USD 208.24; methodology 1.1. | Scores unchanged at 8.8/10 and 2.0/10; three-year returns −4.0% / −67.6%. |
| October 19, 2026 | Added Customers Bank and Knox to growth opportunities and MOPAC/NHS to UK risks. Intraday price USD 194.15; methodology 1.2. | Scores remain 8.8/10 and 2.0/10; base/bear three-year returns +3.0% / −65.3%. |
Rating history
| Assessment date | Methodology | Company strength | Price attractiveness / quote | Reason and comparability |
|---|---|---|---|---|
| October 7, 2026 | Not stated; historical subjective assessment | 8.9/10, historical and non-comparable | No numerical score; October 6 close USD 192.07 | Five component scores and methodology version are missing; no backfill. |
| October 10, 2026 | 1.0 | 8.8/10 | 2.0/10 at USD 209.05; October 9 close | First comparable baseline. |
| October 12, 2026 | 1.1 | 8.8/10 | 2.0/10 at USD 208.24; October 12 close | Regna AI had no quantified contribution; components unchanged. |
| October 19, 2026 | 1.2 | 8.8/10 | 2.0/10 at USD 194.15; intraday 15:55 EDT | New relationships lack disclosed economics and UK risks lack quantified global impact. The lower price improves scenarios, not the risk asymmetry. |
Next review: after Q3 2026 results, scheduled for November 2, 2026 after the US close. Key tests are NDR, US commercial growth, contract conversion, GAAP margin and FCF per share; in the UK, actual use, measurable benefit and new contracts.
October 26, 2026: added operating examples from L3Harris, McCarthy and Tampa General, the Aplos partner update, and European technology-sovereignty risk. Business strength remains 8.8/10 and price attractiveness 2.0/10; at the USD 198.84 close the cases return +0.6% / −66.1%.
| November 9, 2026 | The Q3 10-Q and call added contract, cash-flow and commitment evidence; $169.20 close | Strength unchanged at 8.9/10; attractiveness 2.2 → 2.3/10; returns +23.1% / −57.7% |
| November 16, 2026 | Two live deployments at Zeta customers and a five-year UK police award add evidence of Foundry adoption but do not change financial assumptions or business strength. A lower entry price modestly improves attractiveness, while the margin of safety remains small. | Price attractiveness 2.4/10 at USD 160.39, November 16, 2026 regular close. Three-year returns are 29.9% (base) and -55.4% (adverse), with unchanged scenario assumptions. |
Was this analysis useful to you?